This is the first part of the
GeoGebra 4.0 Sneak Peek Series. In
this series, we are going to discuss
some of the changes in GeoGebra from
version 3.2 to 4.0. If you want to have a complete view of the changes, you
can read the GeoGebra
4.0 Release Notes.
If you don’t know yet, GeoGebra 4.0 will be
released by the end of August 2011. If you’re as excited as me and want to try out the
new features, you might want to
explore the GeoGebra
4.0 Beta release. This release is, of
course, not stable (they may still change some features), so if a
dialog box appears asking you if you
want to associate your GeoGebra file with it, don’t.
The most evident changes in GeoGebra 4.0 are the new tools. The tools,
their icon, and their descriptions
are shown below. Some tools have no icons yet, so I left it blank.
| Icon |
Name |
Description |
 |
Attach/Detach Point |
Attaches/detaches a point to a
particular object. |
| |
Function Inspector |
Displays different properties of
functions (maximum, minimum, roots, etc).
We will discuss this in a
separate post. |
| |
Insert Button |
Inserts a command button in the
GeoGebra drawing pad. |
| |
Insert Text field |
Inserts a text box in the GeoGebra
drawing pad for inputs. |
| |
Pen
Tool |
Enables writing/drawing on the drawing
pad. |
 |
Point on Object |
Creates a point on a region or a
perimeter of a region. |
 |
Polyline |
Creates a series of
segments. |
 |
Probability Calculator |
Computes/graphs different
probability
distributions. |
 |
Rigid
Polygon |
Creates a
polygon that you can
translate or rotate, but can’t change its shape. |
GeoGebra
4.0 has not only improved by adding
additional tools and features, there are also 7 minor changes
in the interface.
Seven “Minor” Changes in GeoGebra’s GUI
1. The Perspective Menu
The most obvious change when you open the
GeoGebra 4.0 window is the addition of the Perspectives menu. This menu will
let you to choose the type of Perspective (combination of windows) to show.
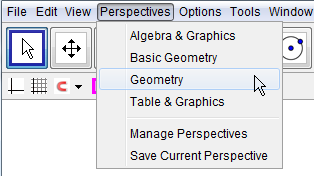
The Perspective Menu
The Basic Geometry perspective, for
example, only reveals a blank drawing pad and displays the basic
tools with no drop down list of tools. The Table & Graphics
perspective shows the Spreadsheet View and a blank drawing pad.
Note: GeoGebra has changed the
term “drawing pad” to Graphics
View to be consistent with Algebra and Spreadsheet Views.
From now on, we will use the term Graphics View in lieu of drawing
pad.
2. Sort Object by Type
Another small improvement (which I really
like very much) is the Sort Object by Type
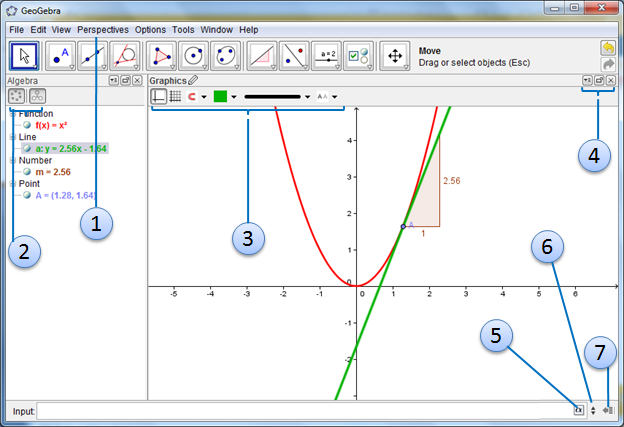
toggle button in the Algebra
window. This enables you to sort the objects into two
types — the first is to three categories: Free, Independent,
and Auxiliary Objects, and
the other one is to sort into object types: Line,
Segments,Number, Point, etc (see Figure
1).
3. Styling Bar
Thank
goodness because we don’t have to right click or double click an
object and open the Properties window when we want to change the color,
style, size, or label type of a particular object.
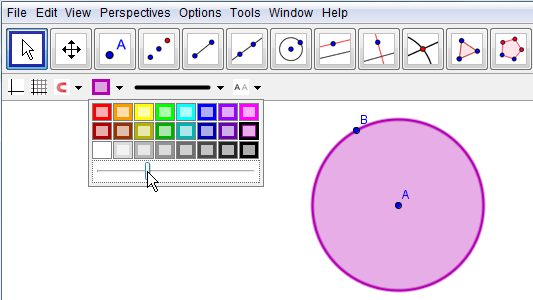
The Styling Bar
In GeoGebra 4.0, a new styling bar is
located at the top of the Graphics
view. It can be shown/hidden using a toggle button discussed in number 4.
4. Action Buttons
I am not sure if the GeoGebra team has given
a name for these three buttons (I can’t
find it), but for now we will call them Action Buttons. The first one
on the left is the Toggle Styling Bar button which shows/hides the
Styling Bar. The second is the Show View in New Window
button which lets the current window float. The third one with the x is of
course, the Close button.
5. The Greek Letters Window
The very long drop down list of Greek
letters in version 3.2 is now in tabular
form.
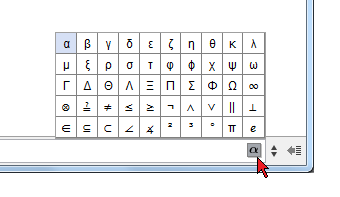
The Greek Letters window
This is a great improvement because we don’t
have to do a lot of mouse scrolling.
6. The Command History
The command history is also improved. In the
last version, you have to press the UP arrow key on your keyboard to view
the previous inputs from the input bar, but in version 4.0, you just have to
click the up button to show the list.
7. Input Help
The GeoGebra commands are more
organized. They are now sorted into
categories and not just listed alphabetically. We can use the Input Help
toggle button as shown in Figure 1 to display the list of commands, then we
can do the 4-step instruction below to use the command below.
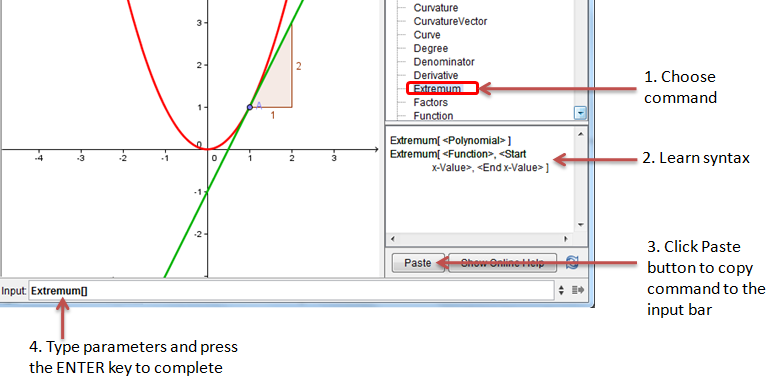
The Input Help
The Text tool was
hard to use in GeoGebra 3.2. When
you want to combine dynamic and static texts,
you have to type confusing codes which include
symbols such as the plus sign and
double quotes.
GeoGebra 4.0,
however, has a much improved Text
tool. In the new version, the name of
each object can bee seen in the Objects drop down list (see Figure
1) on the Text tool dialog box. The
values of these objects can be
inserted in a phrase/sentence by clicking them on the list. After
selecting a particular object, it’s name will be shown in the Edit
window (see Figure 2), while its value will be shown in the Preview
window. This saves us from
writing variables, double quotations, and plus signs manually.
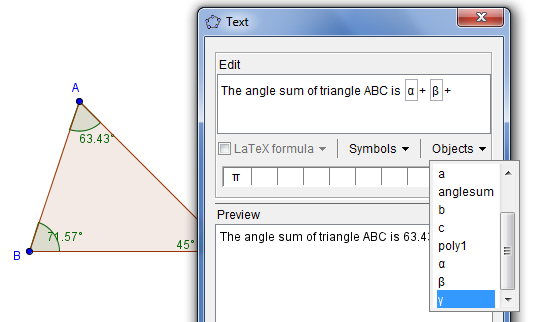
Figure 1 - The Objects drop down list
box
The big problem of the Object list,
however, is when you have constructed a lot objects. This will give you a
very long list, and you will have to do a lot of
scrolling down to look for a
particular object. I hope that this could also be improved later, in
GeoGebra 5.0 perhaps, if it is not possible in the next version.

The Math Symbol Drop Down list
Another improvement in GeoGebra 4.0 is it
has more math symbols. The symbols were also more
organized in the new version.
The long wait is over. GeoGebra
4.0 can now graph inequalities as
shown in Figure 1.

Figure 1 -
Graphs of Inequalities in
GeoGebra
You can
construct the graph above by
typing the following in the Input
bar pressing the ENTER key after each inequality.
- y < 3x
- 2x -1 <= 2
- y > x3 - 2x - 1
The symbol <= can also be found on
the symbol box as ≤. Just click the input bar and click the α
symbol at the rightmost part of the input bar.
When we talk about inequalities, we talk
about solutions. In GeoGebra 4.0, we can graph the solution of
the three or more inequalities above
using logical
operators such as and (denoted
by ∧). The graph shown in Figure 2 is the graph of the inequality (-x + y ≤
3) ∧ (4x + 3y < 12) ∧ (-x – 2y < -2).
-
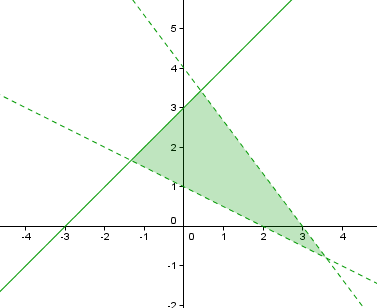
- Figure 2 – Solutions of Inequlities using
logical operators
The inequality is a new feature in GeoGebra
is not yet stable. The logical
operators might
still have problems with functions
with degree more than one. I used the logical operator on the first three
inequalities, which include one quadratic inequality, but no output graph
was shown.
One of the major enhancements of
GeoGebra 4.0 is the integration of
Computer Algebra System (CAS). The GeoGebra CAS window can be viewed by
clicking the View>CAS from the
menu bar. The CAS toolbar includes
the following tools as shown in the first figure:
| Evaluate |
exact evaluation |
| Numeric |
numeric evaluation; e.g. sin(1) |
| Keep Input |
|
| Factor |
|
| Expand |
|
| Substitute |
|
| Solve |
|
|
Differential/ Integral |
|

You can enter expressions/equations at the
CAS window (see black texts below)
and click the buttons at the toolbar
to perform a command. The output of a command is shown in blue texts. Line
1, for example, used the Evaluate button to simplify 2x +
4x – 3y + 2y.

The GeoGebra CAS also accepts keyboard
input; type the command and then the expression. For example,
typing
solve[x^2 -3x + 5 = 10, x]
in the CAS window is just the same as typing
the equation
x^2 -3x + 5 = 10 and then clicking the
Solve button.
For more
information about the GeoGebra CAS commands and their syntax, read the
GeoGebraCAS documentation.
The Function Inspector is a new
tool introduced in GeoGebra 4.0. This
tool ‘inspects’ functions revealing properties
such as its minima, maxima, root,
area, and mean, etc., of a given interval.

The Function Inspector can also
generate tables of values of x
and f(x) given an interval and step value. This is
very useful since we do not have to type them manually and use formulas in
the Spreadsheet View. In addition to the x, f(x)
table of values, we can also add columns that display the
differences between consecutive
f(x) values, first derivative,
and the second derivative.

The Function Inspector can also generate tangent lines and
osculating circle through a particular point on the graph of the function.


